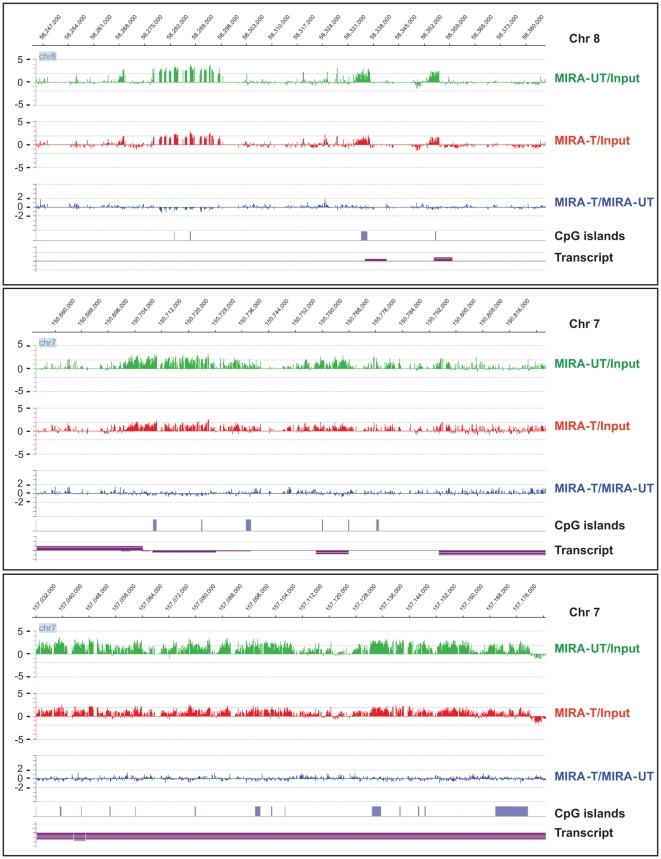
Figure 1. Comparison of DNA methylation profiles between B[a]PDE-treated cells and control by MIRA-assisted microarray analysis.
Genomic DNA of normal human fibroblasts chronically treated with B[a]PDE vs DMSO was subjected to MIRA-assisted microarray analysis, as described in the text. Representative methylation array profiles from different chromosomal regions are displayed with corresponding genomic coordinates (indicated on the top). MIRA-T/MIRA-UT' = MIRA-enriched B[a]PDE-treated DNA vs MIRA-enriched DMSO-treated DNA, ‘MIRA-T/Input’ = MIRA-enriched B[a]PDE-treated DNA vs Input non-enriched B[a]PDE-treated DNA, and ‘MIRA-UT/Input’ = MIRA-enriched DMSO-treated DNA vs Input non-enriched DMSO-treated DNA.

