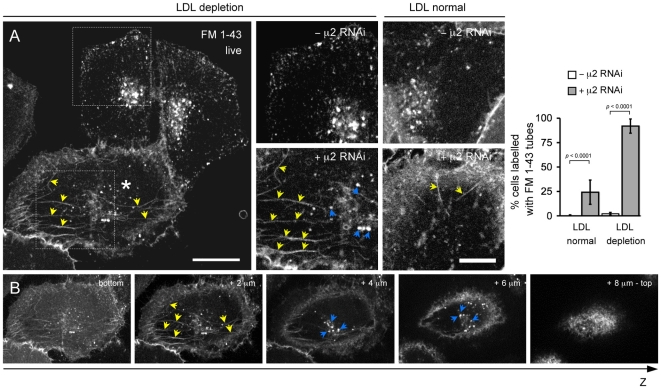
Figure 6. Enrichment of endocytic tubules labeled with FM 1-43 dye in HeLa cells depleted of AP-2 and LDL.
(A) Effect of AP-2 depletion on the enrichment of tubular structures labeled with FM 1-43 fluorescent dye. The experiment was carried out on a mixture of HeLa cells depleted (+ μ2 RNAi) or not (-μ2 RNAi) of AP-2 by treatment with RNAi specific for μ2. Cells were imaged 24 hrs after plating in medium supplemented with 10% FCS (LDL normal) or with LDL-depleted serum (LDL depletion) using a spinning-disk confocal microscope. Cells depleted of AP-2 (marked with an asterisk ‘*’) were identified by the lack of internalized fluorescent Tf following a brief incubation for 5 min with 10 µg/ml Tf-A594 (not shown). Cells were then incubated with 5 µg/ml FM 1-43 for 5 min and imaged live. Yellow arrows in the inset highlight the appearance in the AP-2 depleted cell of tubular structures containing FM 1-43. Blue arrows in the insets highlight spots corresponding to endosomes. Images are representative of 100 random cells analyzed acquired for each category from 3 independent experiments. Bar, 20 µm (10 µm in the insets). The histograms show the fraction of cells containing tubes labeled with FM 1-43 observed in 100 Tf-negative cells selected randomly from the imaging fields. Data for each category were obtained from 3 experiments performed independently. Similar results were obtained using BSC1 cells (not shown). (B) Images from a Z-stack of consecutive optical planes acquired every 0.3 µm. They highlight the presence of intracellular tubular structures labeled with the FM 1-43-dye (yellow arrows) added to the medium. The tubular structures are contained within the cellular boundaries and are therefore located inside the cell. The images also indicate the intracellular location of endosomal spots (blue arrows).

