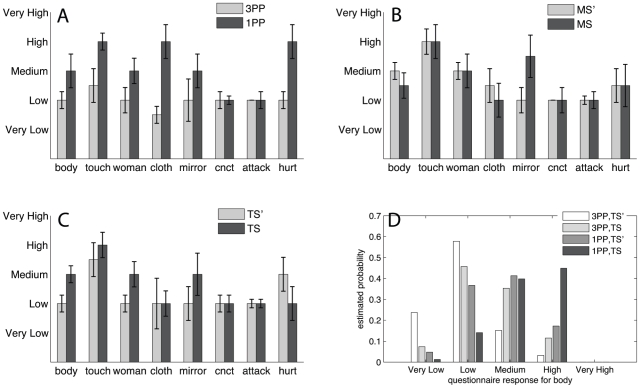
Figure 3. Questionnaire responses for the main effects.
(A–C) show the means and standard errors of the questionnaire responses by each of P, M and T. Using proportional-odds cumulative logit models the notable significance levels are for P (body, p = 0.031; touch, 0.023; woman, 0.033; cloth, 0.003; hurt, 0.046), and T (body, p = 0.095; touch, 0.085; woman, 0.024). The model fits were good, with the highest deviance being 29.8 on 25 d.f. Panel (D) shows the estimated probabilities for the questionnaire responses for body, for four cases: for third person (P3, disembodiment) and for asynchronous (TS′) and with synchronous touch (TS), and for first person (P1, embodiment) again comparing TS′ with TS. In each case M = MS (the graph is almost identical for M = MS′). There were no scores of 10 in these responses which accounts for the low estimated probability of ‘Very High’.

