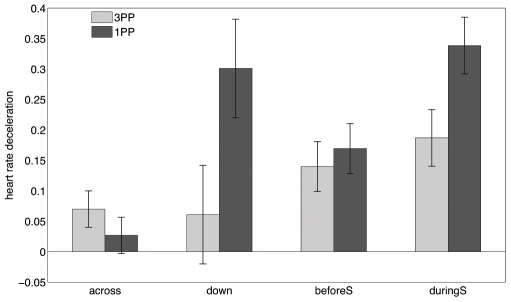
Figure 4. Means and standard errors of the Heart Rate Deceleration data.
The figure shows the means and standard errors for HRD after four events: across: 0.5s after initially arriving at the other side of the room; down: 0.5s after descending from above; beforeS: 7s before the slap; duringS: 2s into the slap sequence. 1PP was significantly greater than 3PP on down (0.028) and duringS (0.034). The ANOVA fits satisfied the requirement of normally distributed residual errors using the Jarque-Bera test [37], except for 1PP on down, where a variable transformation was found to obtain normality.

