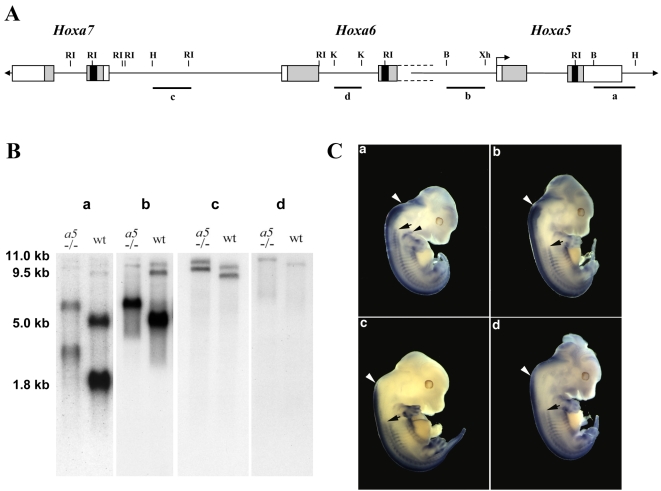
Figure 5. Differential expression pattern of Hoxa5 transcripts.
(A) Genomic organization of the Hoxa5, Hoxa6 and Hoxa7 genes along the cluster. Probes a, b, c and d used for northern blot analyses and whole-mount in situ hybridization are indicated below. (B) Northern blots of polyA+ RNA extracted from e12.5 wild-type and Hoxa5 −/− embryos were hybridized with each probe. (C) Whole-mount in situ hybridization of e12.5 wild-type embryos with probes a-d. Anterior limits of expression are indicated for the neural tube (white arrowheads) and the prevertebral column (black arrows). The different profiles reveal the specific expression of the transcripts: probe a allows to identify the structures that exclusively express the 1.8 kb transcript. Theses structures include the pv3-pv10 axial domain and the pectoral girdle (black arrowhead). The larger transcripts are expressed in more posterior structures than the 1.8 kb transcript. B, BglII; H, HindIII; K, KpnI; RI, EcoRI; Xh, XhoI.

