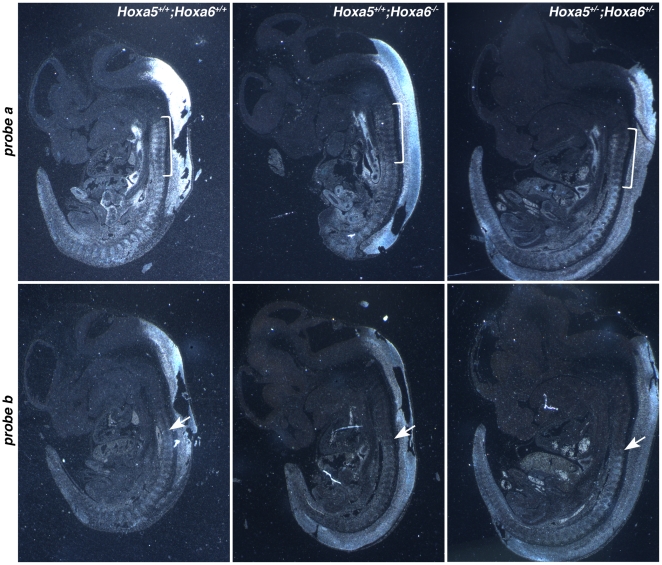
Figure 8. Comparative expression patterns of Hoxa5 transcripts in e12.5 wild-type, Hoxa6 homozygous and Hoxa5; Hoxa6 transheterozygous mutants.
In situ hybridization experiments were performed on comparable sagittal sections. Representative specimens are shown. Genotype is indicated on the top right of each column and probe on the left of each row. The bracket indicates the pv3-pv10 domain, which hybridizes with probe a in wild-type specimens, but not with probe b. In Hoxa6 −/− and Hoxa5 +/−; Hoxa6 −/+ mutants, the signal in this region is significantly decreased with probe a. With probe b, the anterior limit of expression corresponds to pv10 in all samples regardless of the genotype (arrows) with no major change in signal intensity.

