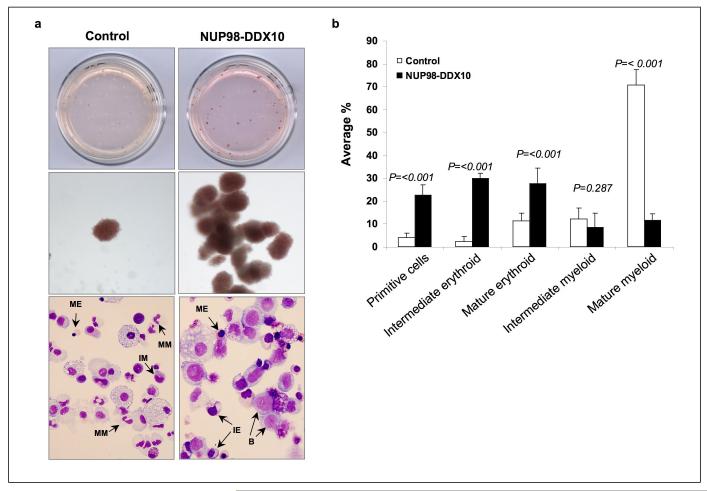
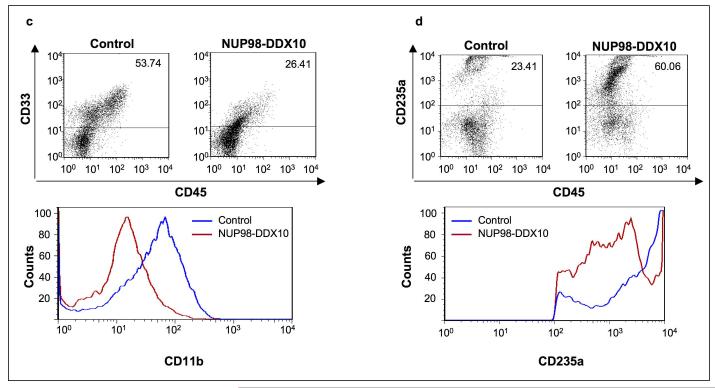
Figure 3.
NUP98-DDX10 disrupts myeloid and erythroid differentiation of primary human CD34+ cells. Human CD34+ cells were retrovirally transduced with either control MSCV-IRES-GFP vector or vector expressing NUP98-DDX10, and cells were sorted for GFP positivity. (a) One thousand cells were seeded into each of two duplicate plates for CFC assay and the experiment was repeated 6 independent times. Representative plates without magnification (upper panels) and low power photomicrographs of representative erythroid colonies (middle panels) are shown. Cytospin smears were prepared from the CFC plates and stained with Giemsa (lower panels). Photomicrographs were taken from representative fields with a 60X oil objective. Representative cells are indicated by arrows. B: blast; MM: mature myeloid; IM: intermediate myeloid; ME: mature erythroid; IE: intermediate erythroid. (b) 500 cell differential counts were performed to distinguish 5 groups of cells. Cells with blast and promyelocyte morphology were counted as primitive; those with myelocyte/metamyelocyte morphology as intermediate myeloid; those with band, segmented neutrophil, monocyte, and macrophage morphology as mature myeloid; those with intermediate hemoglobinization as intermediate erythroid; and those with full hemoglobinization as mature erythroid. Averages from 6 independent experiments are shown; error bars represent standard deviations. The P value was obtained by comparing to control using a two-sample, equal variance, two-tailed distribution t-test. (c) Flow cytometry for myeloid differentiation: Cells from the CFC plates were harvested and stained with CD45, CD33 and CD11b; the CD33+ gate was plotted on a histogram to show CD11b expression compared to control (lower panel). (d) Flow cytometry for erythroid differentiation: Cells from the CFC plates were harvested and stained with antibodies to CD45 and CD235a. The CD235a+ gate was plotted on a histogram (lower panel) to show the expression of CD235a relative to control cells. The percentages of cells falling within each gate are shown.


