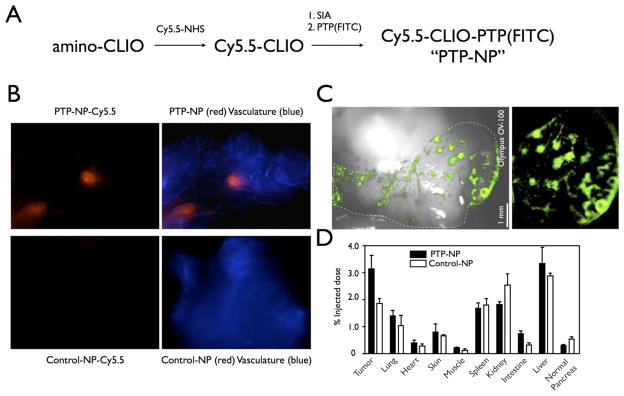
Figure 12.
Fluorescence imaging of PDAC using PTP-NP or Control-NP. (A) Schematic of conjugation of PTP to NP. Control-NP is synthesized the same way with substitution of control peptide for PTP. (B) Intravital confocal microscopy of early pancreatic lesions imaged using PTP-NP (red, top) or control-NP (red, bottom) and AF750-labeled bloodpool agent (blue). (C) Low-magnification view of pancreatic fluorescence shows distribution of PTP-NP in distinct areas of the pancreas. White light overlay provides anatomic correlation (left). Dotted line outlines the pancreas. (D) Biodistribution of PTP-NP and control-NP. Reprinted with permission from reference number 53 (Figure 5), Copyright 2008 PLoS Medicine.

