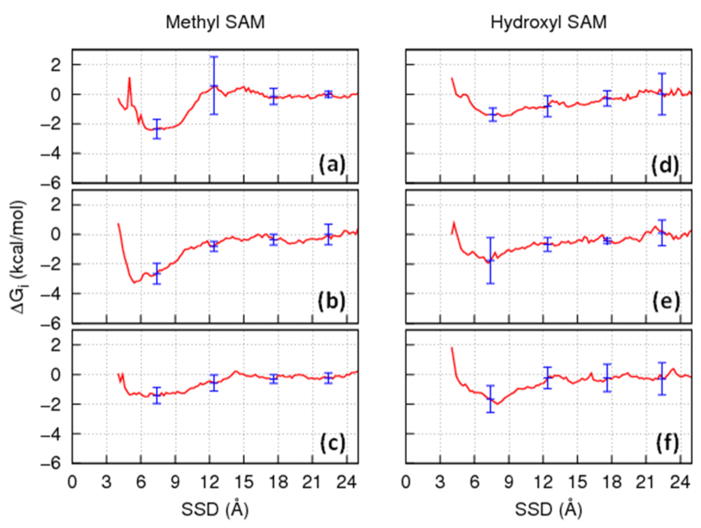
Figure 3.
Free energy profiles (red lines) extracted from the REMD simulation results with error bars representing 95% confidence intervals (n = 3) about the means for each of the TGTG-X-GTGT peptides, where (a) X=Val, (b) X=Thr, and (c) X=Asp over the CH3-SAM surface and (d) X=Val, (e) X=Thr and (f) X=Asp over the OH-SAM surface.

