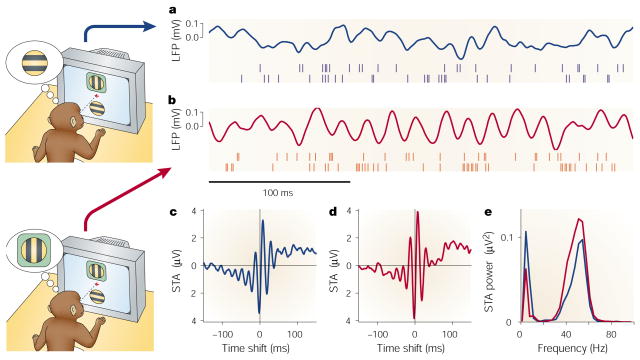
Figure 4. Attention induces changes in synchrony in the visual cortex.
Data shown are from experiments in which two visual stimuli were presented, one inside and one outside the receptive field of a neuron in area V4. In the schematics, the green box represents the receptive field: this was not presented on the screen in the trials. Red traces correspond to attention directed inside the receptive field of the recorded neuron; blue traces correspond to attention directed outside. Stimuli were the same in the two conditions. a and b| The continuous traces show the stimulus-driven local field potentials (LFPs). The spikes below were recorded simultaneously from different electrodes. c and d| Spike-triggered averages (STAs) computed during the stimulus presentation period. The STA corresponds to the average LFP waveform that is seen at the time of a spike. The y axes indicate the mean LFP; the x axes indicate time relative to the occurrence of a spike. e| Power spectra of the two STAs shown in c and d. When attention is focused inside the receptive field, the recorded neuron tends to fire more in phase with the frequency components around 50 Hz, and less so with respect to the frequencies around 10 Hz. Data modified from REF. 113 and kindly provided by P. Fries.

