Figure 3.
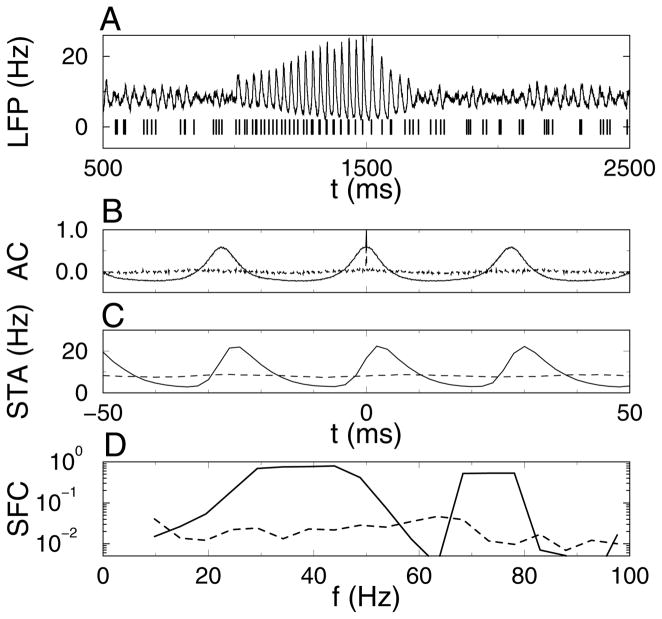
Spike field coherence (SFC) is increased during the synchronous episode. (A, top) The simulated local field potential (LFP) was calculated by convolving the spike time histogram with an exponential filter (time constant 5 ms). (A, bottom) Simulated multiunit recording consisting of the combined spike trains of two activated and two nonactivated neurons. (B) Autocorrelation of the spike time histogram during (solid line) synchronous period (IIB, 1200–1500 ms) and (dotted line) asynchronous period (IB, 700–1000 ms). (C, D) Spike-triggered average (STA) of the LFP triggered on the simulated multiunit recording and the resulting SFC during (solid line) a 1500 ms long synchronous period and (dashed line) an asynchronous period of equal length. Data for A and B are from the simulation results shown in Figure 1B. Data in C and D are from a 6000 ms long simulation with the same parameters, except that the current pulse was applied during the time interval between 2000 and 4000 ms. The synchronous period used for analysis was between 2500 and 4000 ms, and the asynchronous period was 4500 to 6000 ms.

