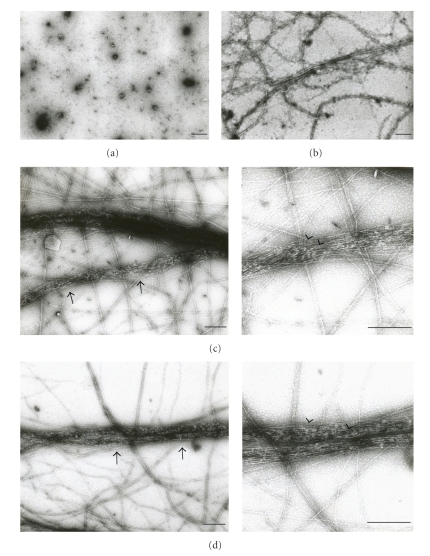
Figure 6.
Negative-stained electron micrographs of actin filaments under the influence of purification nebulin. (a) nebulin only, 19 μg/ml; (b) actin only, 0.2 mg/ml; (c and d) actin (0.2 mg/ml) was mixed with nebulin (19 μg/ml) in 0.11 M KPO4, 0.31 M urea, 0.27 mM ATP and 0.1 mM MgCl2, pH 7.0. Bar, 200 nm.

