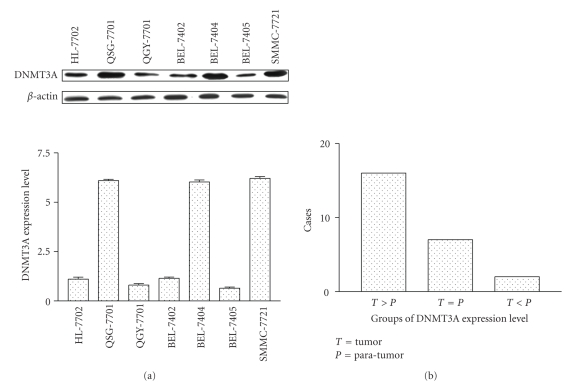
Figure 1.
DNMT3A expression is analyzed in HCC cell lines, HCC tumor tissue, and adjacent nontumor samples. (a) DNMT3A protein expression level was detected in HCC cell lines by western blot. Upper panel, DNMT3A was examined by western blot in HCC cell lines. Bottom panel, the intensity ratios of both target gene band and control from the same sample were determined and calculated by Gel-Pro Analyzer 3.0. DNMT3A was increased more in 3 HCC cell lines than in immortalized normal liver cell line HL-7702. (b) Real-time quantitative RT-PCR analysis of DNMT3A expression in 25 pairs of HCC specimens and adjacent noncancerous liver tissues, normalized to β-actin.

