
Figure 3.
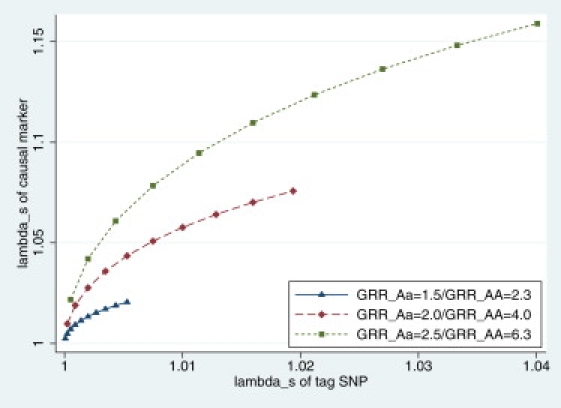
Illustration of λS for a Tag SNP and a Synthetic Causal Marker
The relationship between λS for a tag SNP with MAF = 30% and the true λS for a synthetic causal marker is shown, with MAF ranging from 1% to 10% (each dot represents 1% increase), under three effect sizes with multiplicative genetic models. In all cases, the tag SNP underestimates the familial aggregation explained by the true causal variant.