
Figure 3.
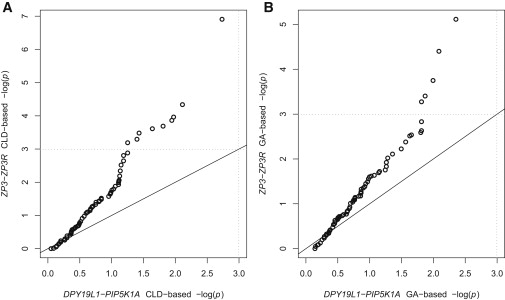
Q-Q Plot Comparing ZP3-ZP3R with Random Gene Pairs
These Q-Q plots compare the (A) X12-based and (B) X42-based permutation p values between ZP3-ZP3R and PIP5K1A-DPY19L1. The dotted lines indicate significance thresholds with α = 0.05.
Official websites use .gov
A
.gov website belongs to an official
government organization in the United States.
Secure .gov websites use HTTPS
A lock (
) or https:// means you've safely
connected to the .gov website. Share sensitive
information only on official, secure websites.
Q-Q Plot Comparing ZP3-ZP3R with Random Gene Pairs
These Q-Q plots compare the (A) X12-based and (B) X42-based permutation p values between ZP3-ZP3R and PIP5K1A-DPY19L1. The dotted lines indicate significance thresholds with α = 0.05.