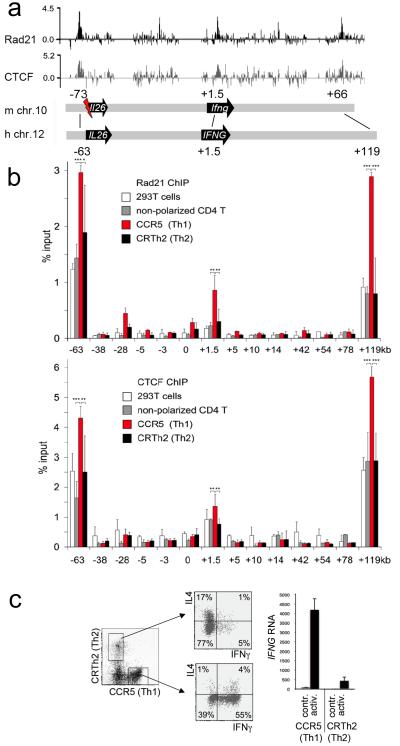
Figure 1. Developmentally regulated cohesin and CTCF binding at IFNG.
a) ChIP and genomic tiling array data for the mouse B3 pre-B cell line10 show log2 enrichment of the cohesin subunit Rad21 (black) and CTCF (gray) at Ifng. Schematic representation of the mouse Ifng region (m chr.10) and the human IFNG region (h Chr.12), a flash indicates genomic rearrangement at Il26, a pseudogene in rodents20.
b) ChIP and real time PCR mapping of Rad21 (top) and CTCF (bottom) at human IFNG in 293T cells (white), non-polarized CD4 T cells (grey), CCR5+ Th1 (red) and CRTh2+ Th2 (black) effector memory cells. Star symbols indicate statistical significance (Student’s T test) *** p<0.005, ** p<0.05, * p<0.05. Primer positions are indicated relative to the IFNG transcription start site. Human/mouse identity at the −63 kb site is 59% over 291bp surrounding a canonical CTCF consensus motif. Two evolutionary conserved regions (ECR, www.dcode.org) are found at +1.5 kb (70.2% and 69.1% identity over 104 and 217bp) and three at +119 kb (70.0%, 71.0% and 62.2 and 69,1% identity over 120, 100 and 45bp). Positive control sites at Chr11:118283kb, Chr11:118333kb, CD8 Cluster I and ZPF54 were included in all experiments (supplementary figure 1) and data are normalized to Chr11:118283kb (mean±SD, n=4).
c) Isolation (left) of human effector memory CCR5+ Th1 and CRTh2+ Th2 cells and cytokine expression assessed by intracellular staining and flow cytometry (middle) or real time RT-PCR analysis before (contr.) and after activation with plate bound anti-CD3 and anti-CD28 (activ., right).

