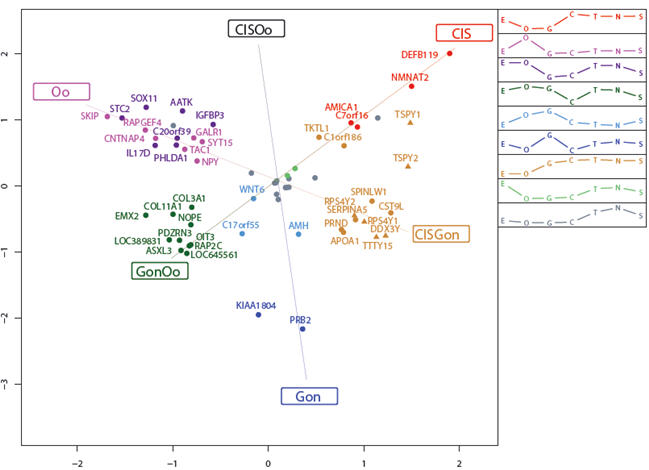
Figure 5. Correspondence analysis of genes characterizing CIS, gonocytes and oogonia.

Correspondance analysis for the 62 most significant genes from a three-way significance analysis of microarrays (SAM) on the classes CIS, gonocytes and oogonia. The 62 genes were clustered into nine distinct gene groups (visualized by colouring), and the corresponding mean cluster profiles are displayed as legend. The positions of the cluster names (CIS, CISOo, etc.) represent the ideal profiles for genes expressed only in the particular cell types. Δ, Gene located on the Y chromosome. Abbreviations: E, embryonic stem cells; O, oogonia; G, gonocytes; C, carcinoma in situ; T, testis tissue containing CIS; N, normal testis; S, Sertoli cells next to CIS; CISOo, CIS and oogonia; GonOo, gonocytes and oogonia and CISGon, CIS and gonocytes.
