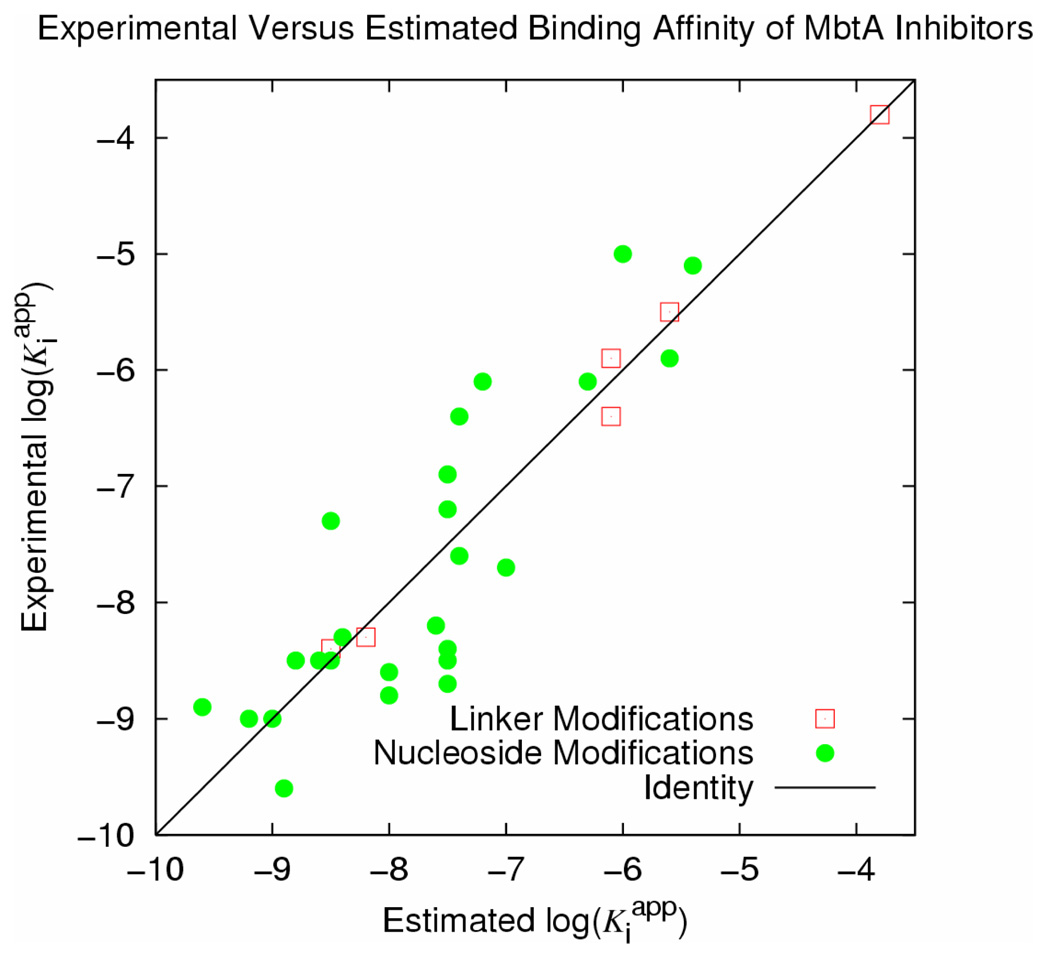
Figure 4.
Plots of the estimated versus experimental binding affinities for MbtA Inhibitors using model I after 150 ps molecular dynamics simulations. The linker set (6 compounds, hollow red squares) and nucleoside set (25 compounds, filled green circles) are treated separately (see Table 1, LI and NI, respectively). The solid identity line represents the point where prediction is equal to the experimental value.

