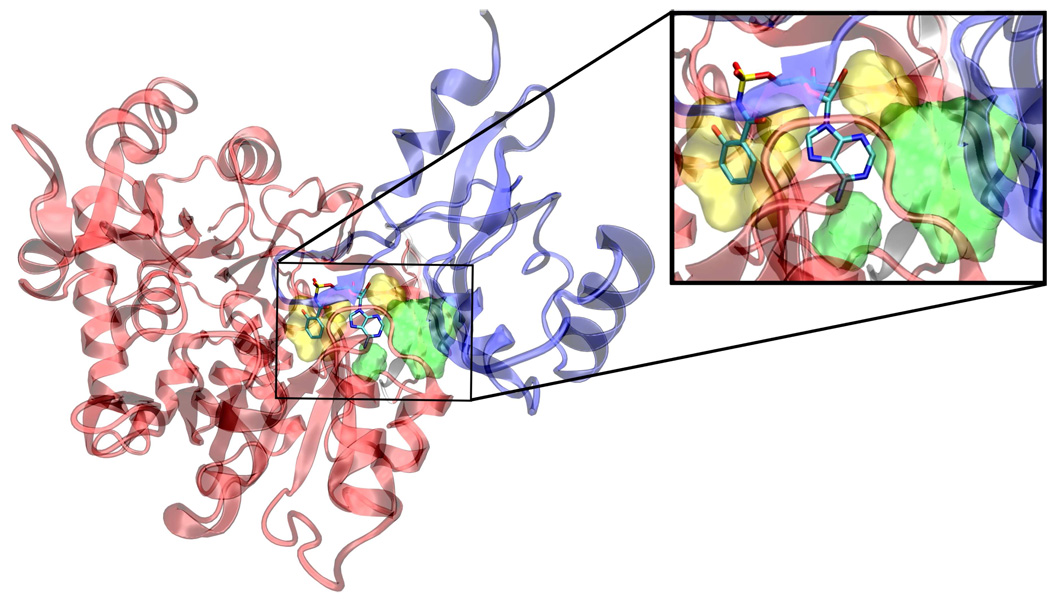
Figure 6.
Sal-AMS (1) docked in the MbtA homology model. The protein is represented as a ribbon diagram, N-terminal red, C-terminal blue. The ligand is shown in a tube representation and colored by element. The green surfaces expose volumes that, when filled with hydrophobic groups, improve potency and specificity. The larger of the two is the C-2 cleft (accessed by compounds 25–31) while the smaller is the N-6 pocket (accessed by compounds 16–24). Filling the yellow volumes results in a reduction in potency.

