Figure 1.
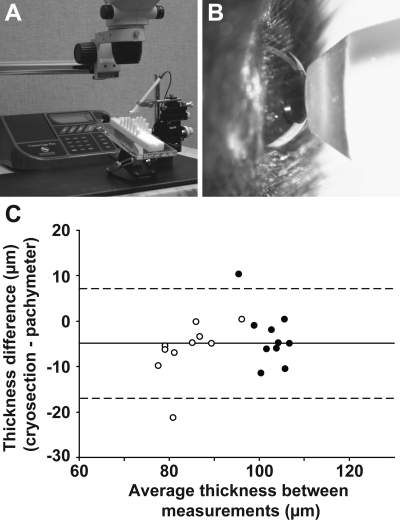
Ultrasound pachymetry of mice. (A) Equipment used to measure murine CCT. (B) Pachymeter probe in contact with mouse cornea. (C) Bland-Altman plot indicating that CCT measured by pachymeter or cryosection yields similar values, though cryosection measurements are slightly thinner. Solid line: average difference; dotted lines: 95% limits of agreement (±1.96 SD); (○): 21-day-old mice; (●): 10-month-old mice.

