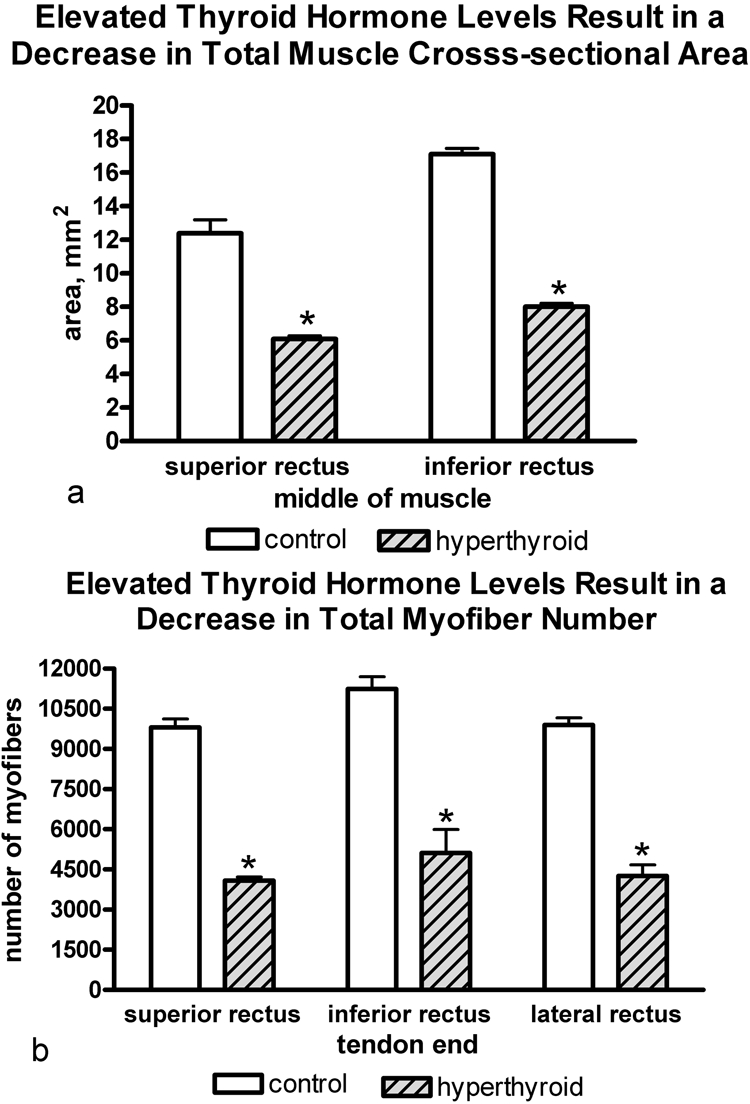
Figure 1.

(a) There was a significant decrease in overall muscle mass as indicated by midbelly cross-sectional areas in the hyperthyroid EOMs in all rectus muscles studied (SR and IR shown here) compared with control EOMs. Individual myofiber cross-sectional areas were unchanged. (b) There was a decrease in the total number of myofibers in all three muscles compared with control EOMs. *Significant difference from controls. Data are the mean ± SEM.
