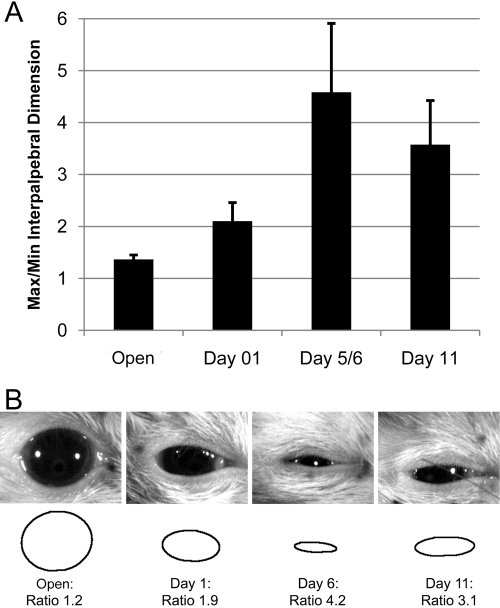
Figure 3.
(A) The average ratio of maximum divided by minimum dimension (±SD) of the exposed cornea within the palpebral fissure during attempted eye closure after orbicularis oculi paralysis is shown at postsurgical days 1, 5 and 6 (combined), or 11 versus the baseline open state (n = 13 per data point). All average ratios significantly differed from one another (P < 0.01). (B) Representative high-speed video frames with automated ellipse calculations of exposed cornea and ellipse max/min ratio calculations are presented for the time points shown in (A). Examples for each time point are within 15% of average values. Note the retracted appearance of the eye surface during partial eyelid closure, particularly at day 1.

