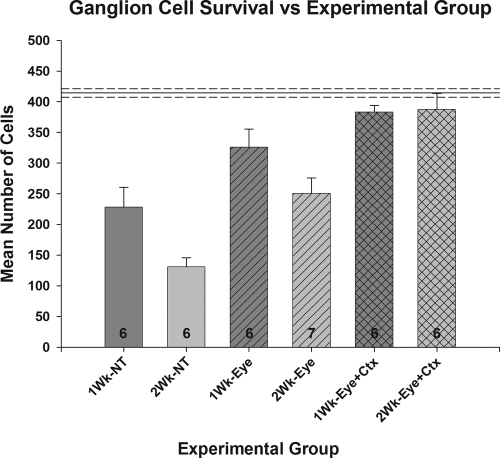
Figure 2.
Comparison of mean ganglion cell survival under each experimental condition tested. Solid line: the mean number of cells counted in the normal fellow eyes. Mean ± SE (NT versus N: P < 0.001; Eye versus NT: P < 0.05; Eye+Ctx versus Eye: 1 week, NS; 2 week, P < 0.05; Eye+Ctx versus N: P > 0.05).

