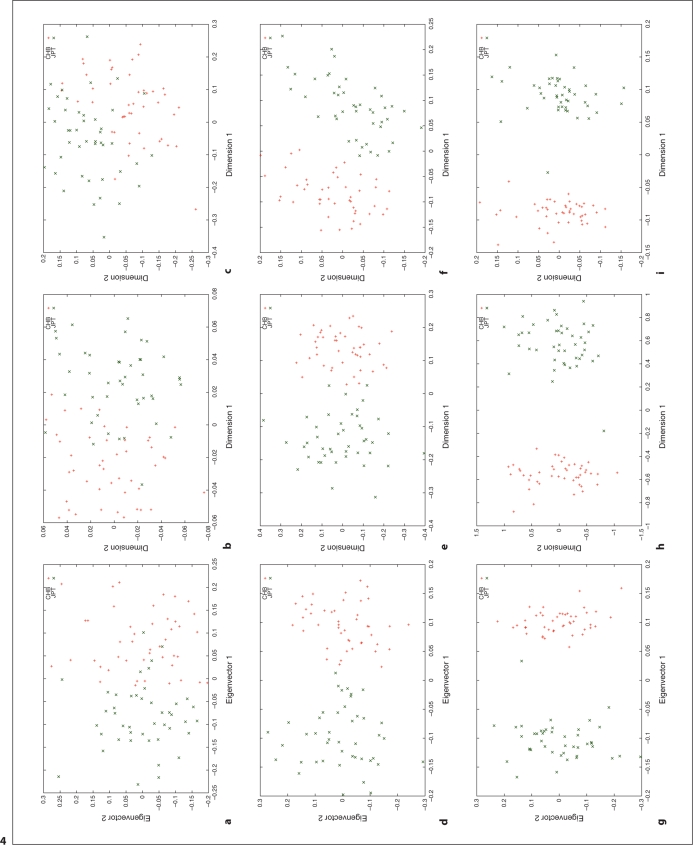
Fig. 4.
Cluster results for the CHB and JPT individuals. This figure shows the clustering results using different distance metrics and clustering methods with a number of genome-wide random autosomal SNP loci. In the left column, (a), (d) and (g) correspond to the clusters generated using the covariance matrix and PCA. In the middle column, (b), (e) and (h) correspond to the clusters generated using the ASD matrix and MDS. In the right column, (c), (f) and (i) correspond to the clusters generated using the correlation matrix and MDS. In the top row, (a), (b) and (c), 1000 SNPs are used. In the middle row, (d), (e) and (f), 5,000 SNPs are used. In the bottom row, (g), (h) and (i), 20,000 SNPs are used. Abbreviation: SNP = single nucleotide polymorphism; PCA = principal component analysis; ASD = allele sharing distance; MDS = multidimensional scaling.

