
Figure 2.
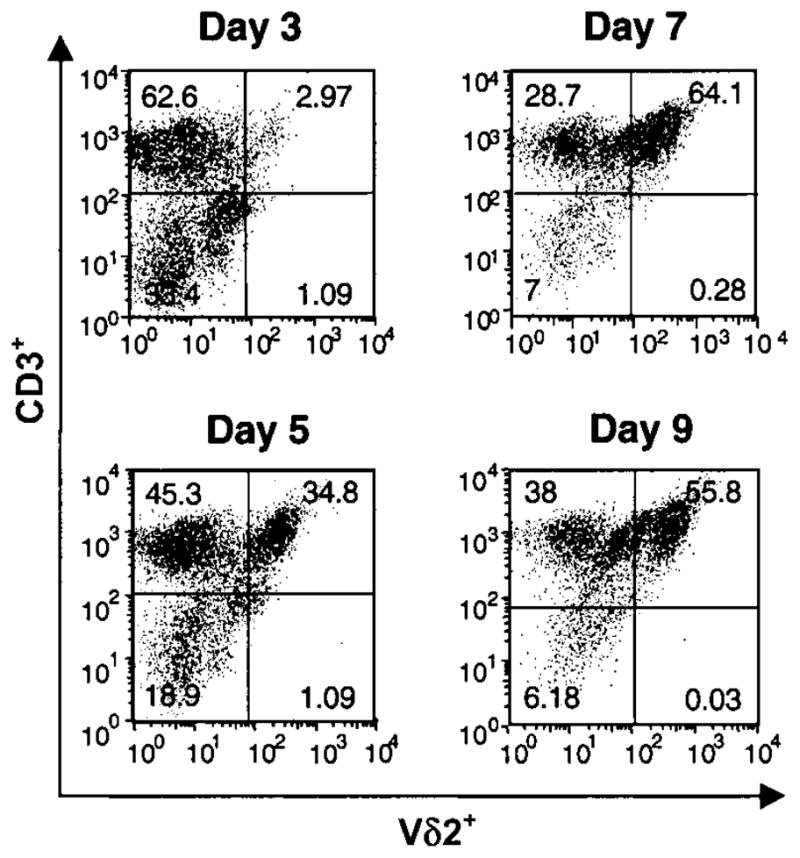
Kinetics of Vδ2+ T cell expansion in peripheral-blood mononuclear cells (PBMCs) in response to bromohydrin pyrophosphate (BrHPP). PBMCs from tuberculin skin test–positive subjects were stimulated with BrHPP (1 μmol/L) and interleukin-2 (25 U/mL), and cells were harvested at indicated time points. Viable cells were analyzed by 2-color flow cytometry for αβ T cell receptor, CD3, and Vδ2 expression. The percentages of Vδ2+CD3+ cells at baseline and days 3, 5, 7, and 9 are shown for 1 representative experiment of 4.