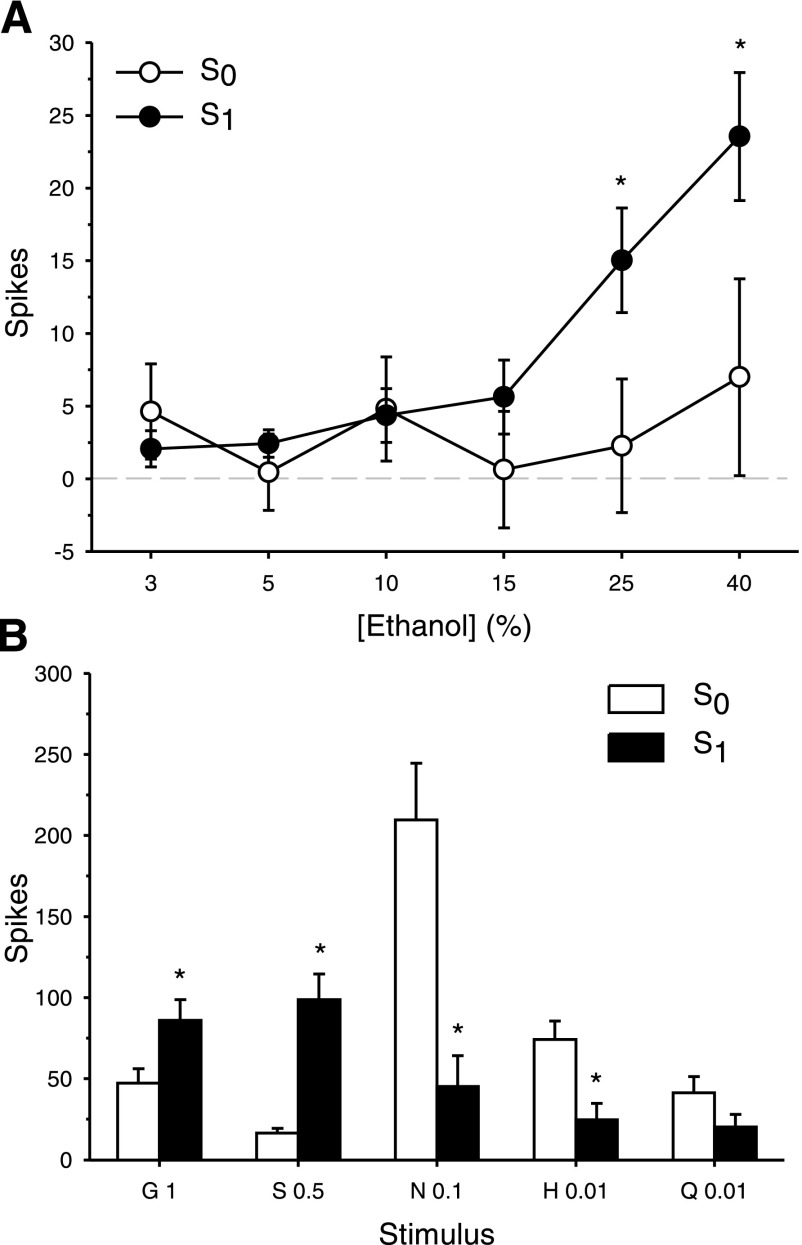
Fig. 5.
Responses to ethanol and taste stimuli in sucrose responsive (S1, n = 15) and sucrose nonresponsive (S0, n = 11) NTS neurons recorded from C57BL/6J WT mice. A: mean ± SE responses in S0 and S1 cells to an ascending concentration (%, vol/vol) series of ethanol. B: mean + SE responses in S0 and S1 cells to glycine (G), sucrose (S), NaCl (N), HCl (H), and quinine (Q). Concentration ([M]) follows abbreviation. *Significant difference between S0 and S1 (P < 0.05).

