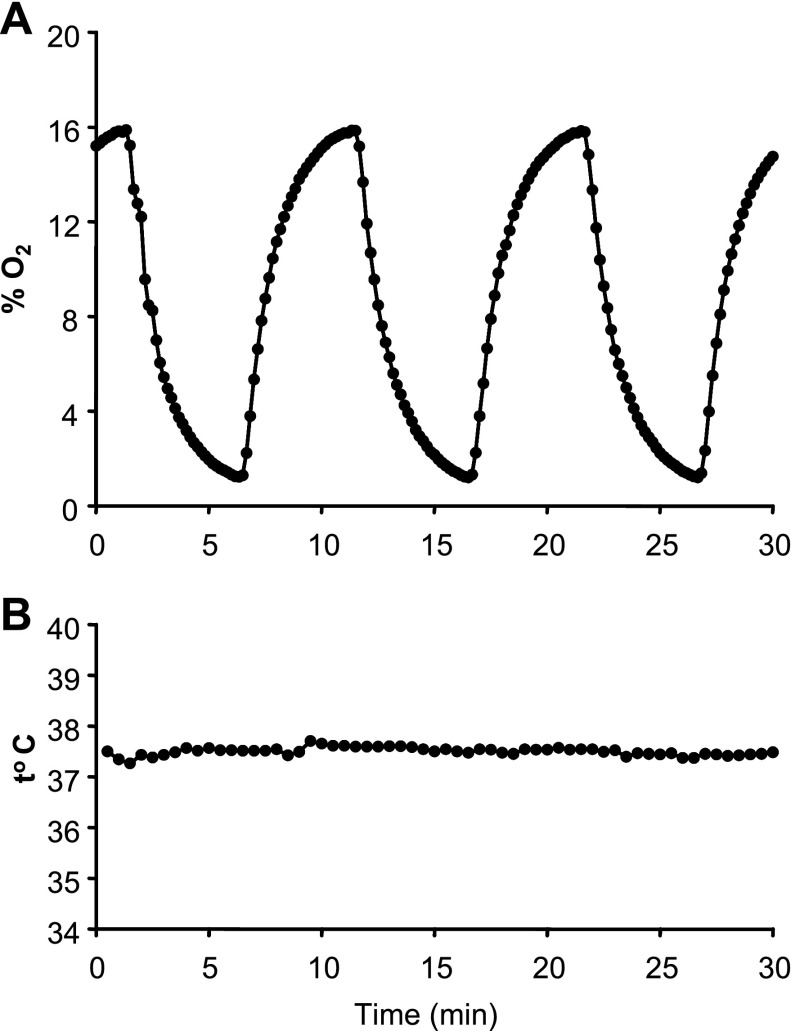
Fig. 2.
Representative O2 profile (A) and temperature (B) during IH were recorded simultaneously in the T-75 flask. An OM-4 oxygen meter (Microelectrodes, Bedford, NH) and an electronic temperature probe (4600; YSI, Dayton, OH) were utilized, and data were captured with a Powerlab 8Sp Data Acquisition system (AD Instruments, Colorado Springs, CO).

