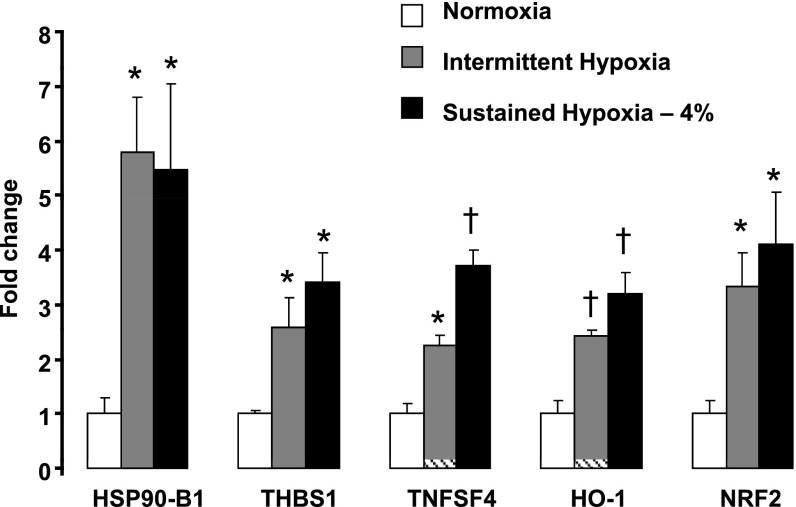
Fig. 4.
Expression of heat shock protein 90 kDa β1 (HSP90-B1), thrombospondin 1 (THBS1), tumor necrosis factor (ligand) superfamily, member 4 (TNFSF4), heme oxygenase-1 (HO-1), and nuclear factor (erythroid-derived 2)-like 2 (NRF2) mRNA in HAEC after exposure to control condition, IH, or SH (4% O2) for 8 h measured by real-time PCR (n = 5 for each exposure). Results were normalized as ratios to 18S and then expressed as fold change compared with control condition. *P < 0.05, †P < 0.01 for difference between hypoxia and control.

