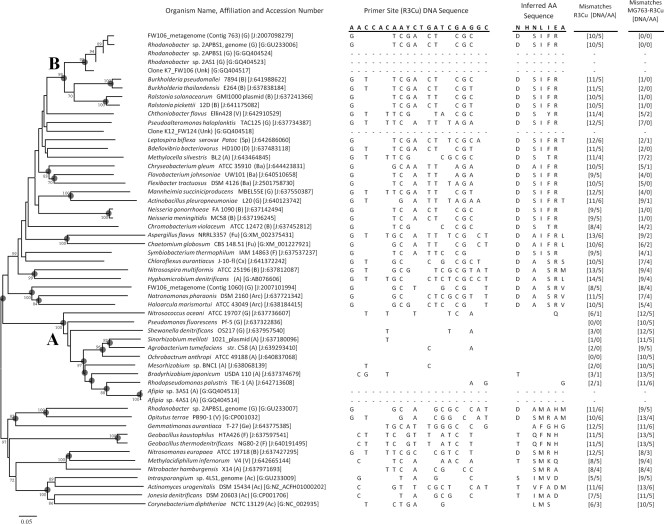
FIG. 3.
Unrooted phylogeny of partial and complete nirK sequences. The trees were generated based on aligned amino acid (AA) sequences inferred from DNA sequences. The numerical values at the nodes represent bootstrap values (1,000 iterations), and nodes with gray circles are supported by Bayesian posterior probability values greater than 95%. The scale bar represents 5% distance after Poisson correction. Organism affiliations are in parentheses (Ac, Actinobacteria; Ba, Bacteroidetes; Cx, Chloroflexi; F, Firmicutes; Ge, Gemmatimonadetes; A, Alphaproteobacteria; B, Betaproteobacteria; D, Deltaproteobacteria; G, Gammaproteobacteria; Sp, Spirochaetes; V, Verrucomicrobia; Arc, Archaea; Fu, fungi). Accession numbers are in brackets, and the database is indicated (G, GenBank; J, JGI gene object ID). Adjacent to each organism is the DNA and inferred amino acid sequence for the class I nirK primer R3Cu (primer set 2 in Table 1), with the primer sequence shown for the sense strand. DNA and amino acid mismatches relative to the R3Cu primer sequence and inferred AA sequence are indicated. In addition, DNA and AA mismatches relative to the MG763-R3Cu primer sequence are shown (primer set 3 in Table 1). Differences from the primer DNA sequence and inferred AA sequence are indicated for each sequence by showing the different base or residue. No sequence data at the primer sites are included for sequences recovered in this study, as these primer sequences were used for amplification of the gene fragment.

