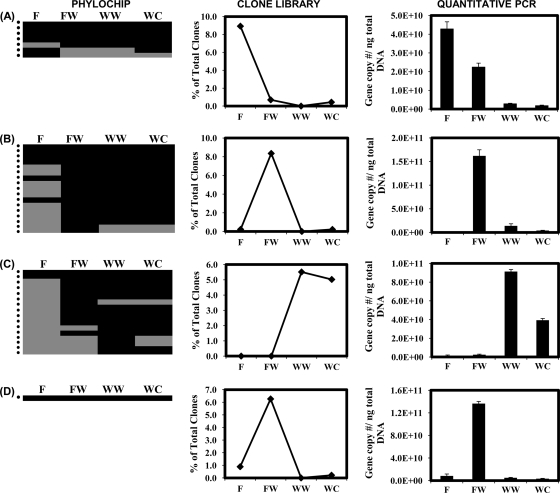
FIG. 4.
(A) Acidimicrobiaceae and (B) Streptomycetaceae families within the Actinobacteria phylum and (C) Flexibacteraceae and (D) KSA unclassified families within the Bacteroidetes phylum that had significant changes with depth as viewed by PhyloChip and clone library analyses. PhyloChip results are presented as a presence (black)-absence (gray) heat map for each OTU detected within the family. Each row marked by a dot on the left represents a unique OTU. An OTU was determined to be present in a soil layer if the pf value was above or equal to 0.92 for both PhyloChips. Clone abundance of each family is reported as the percentage of the total clones detected per soil layer. Quantitative PCR was performed using family-specific primers for amplification of the 16S rRNA gene. F, fill; FW, fill-waste interface; WW, wood waste; WC, waste-clay interface.

