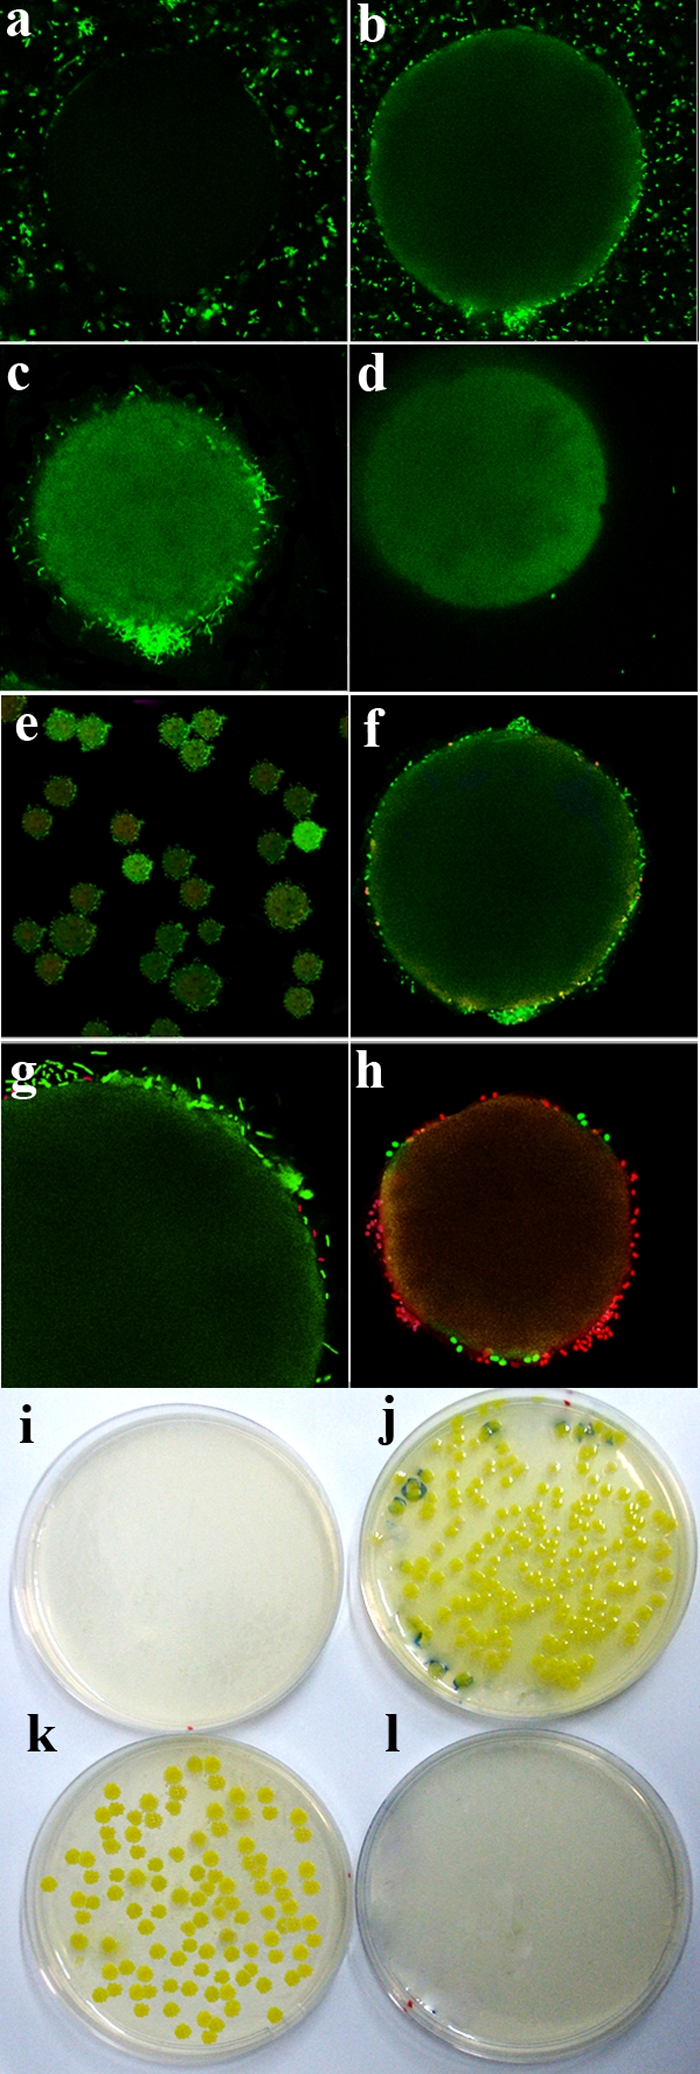
FIG. 3.

Visualization of ROAK-bound bacteria. (a to d) Representative fluorescence confocal microscopy images of GFP-expressing E. coli using the capture assay. (a) Protected (control) ROAK beads before filtration. (b to d) Deprotected ROAK bead before filtration (b), after filtration (c), and after 5 min of treatment with 70% ethanol (d). Note that the residual green color on the beads is likely to be generated from diffuse GFP emanating from ethanol-induced lysis of bacteria. (e to h) Representative images of ROAK-bound bacteria after propidium iodide treatment. (e) Low-magnification image. Green and red colors indicate live and dead bacteria, respectively. (f and g) Two successive zoom views that highlight a representative ROAK bead from panel e before treatment with bactericidal dermaseptin. (h) The same bead after treatment with bactericidal dermaseptin. (i to l) Bacterial capture and viability. Shown are CFU resulting from the capture assay followed by plating of beads (j and l) and filtrates (i and k) on LB agar using deprotected (i and j) and protected (k and l) beads.
