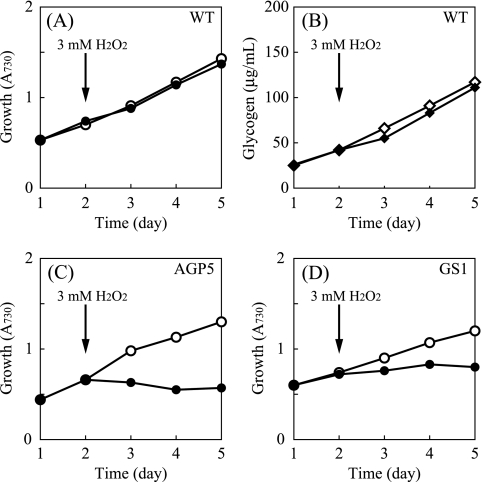
FIG. 5.
Growth and carbohydrate content of S. elongatus PCC 7942 during liquid culture in the presence of H2O2. (A, C, and D) Change in cell density as determined by A730. The name of the strain is indicated in each panel. (B) Glycogen content of WT cells. For the culture indicated by the closed symbols, 3 mM H2O2 was added at the time indicated. The glycogen content of the mutant strains remained below detectable levels throughout the experiment (not shown).

