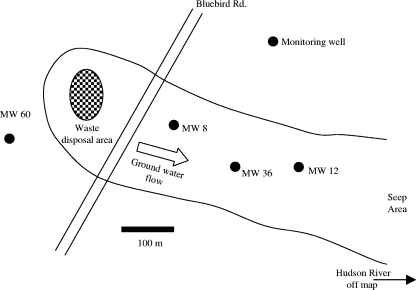
FIG. 1.
Map of field study site, showing the locations of monitoring wells (MW), the boundary of groundwater contamination, and the direction of groundwater movement. MW 60 is the site used for determining background geochemical conditions and microbiology. MW 36 is the site where there was the greatest contamination. (Adapted from reference 79.)

