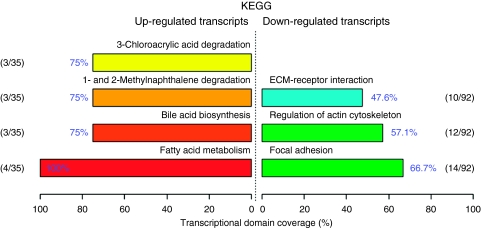
Figure 1.
Functional profiling depicts significantly overrepresented KEGG pathways on the basis of differentially expressed genes in cachexia vs weight-stable patients. Using the FunNet tool, functional profiling was performed using an FDR of 5%. Only genes that have at least one annotation in KEGG were analysed. Of the 61 upregulated genes, 35 were annotated. Of the 364 downregulated genes, 92 were annotated. The number of genes associated with each significant pathway is indicated in relation to the total number of annotated genes in our lists of differentially expressed genes. Transcriptional domain coverage indicates the most significant biological functions that are represented among annotated genes, ranked by percentage.

