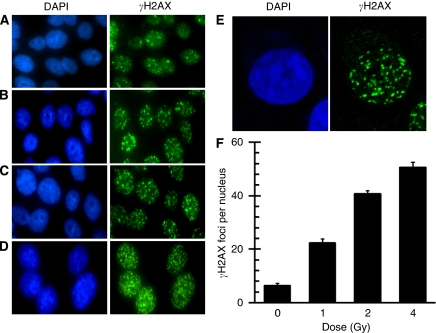
Figure 1.
Dose response of γH2AX focus formation in lymphoblast cell lines (LCLs). Immunocytochemistry (ICC ) was used to capture representative γH2AX focus images from asynchronous log-phase non-radiosensitive (RS) control cells (control-5) before (A) and 1 h after 1 Gy (B), 2 Gy (C) and 4 Gy (D) of ionising radiation (IR). (E) A more detailed view of γH2AX focus distribution, apparently not limited to either euchromatin or heterochromatin in a cell exposed to 2 Gy of IR. Slides were counterstained with DAPI to visualise nuclei (left panels). γH2AX foci were quantified as foci per nucleus for each dose (F). Error bars are the standard error of the mean (s.e.m.) of γH2AX foci number per nucleus from three separate experiments, wherein at least 100 nuclei cells were scored per dose.

