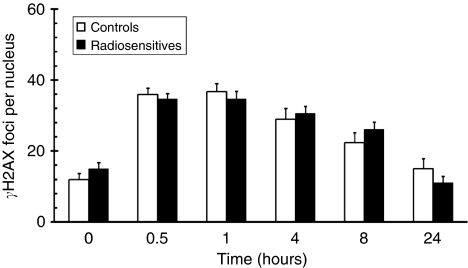
Figure 3.
Time-course kinetics of IR-induced γH2AX foci in LCLs derived from clinically RS individuals (n=18) vs control LCLs (n=11). γH2AX focus number was measured in control (open bars) and RS (filled bars) cell lines before (0 h) and at various times after 2 Gy of IR. Error bars represent s.e.m. of foci number per nucleus based on 4–5 fields of approximately 20–25 cells per field. Data have been graphed from 0 to 8 h for all RS and CL cell lines (controls: n=11; RS: n=18), and at 24 h for a random subset of cell lines (controls: n=5 [CL1, CL3, CL4, CL9, CL11] RS: n=13 [A1, A2, A3, A4, A6, A7, L3, L5, L6, L7, L9, L11]) (Table 1).

