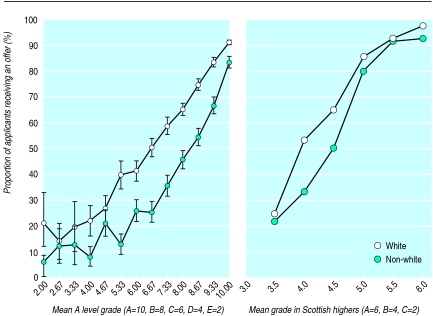
Figure 1.
Percentage of applicants receiving an offer in relation to educational achievement and ethnic group. Bars show 95% confidence intervals; they are not shown for mean grade in Scottish highers because sample sizes were comparatively small in some groups. Overall difference between white and non-white applicants for highers was significant (P=0.0232) after taking all other factors into account (see text)

