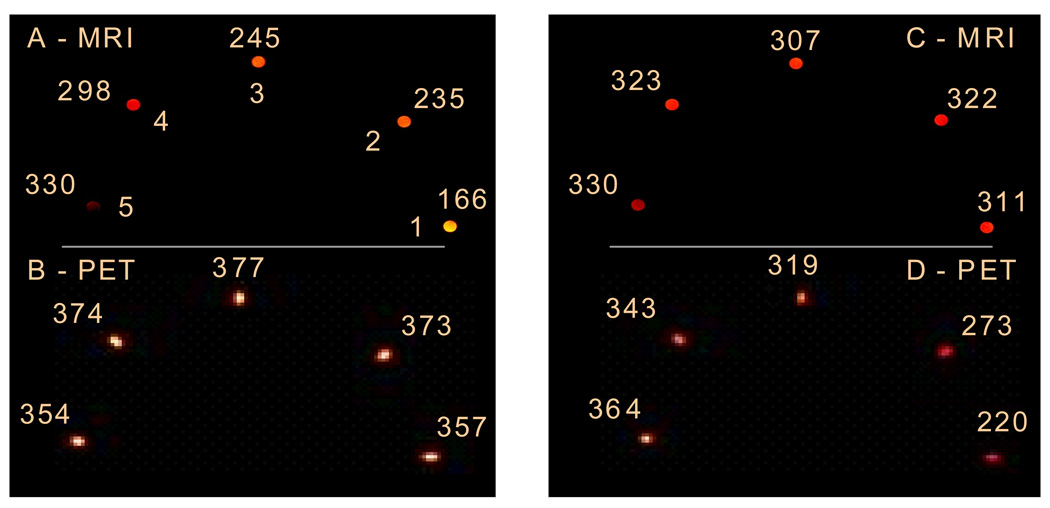
Figure 2.
T1-weighted MR images (A and C, T1 values (ms) listed) and PET images (B and D, PET intensities (a.u.) listed) of phantoms at pH 6.5 (tube 1), 6.8 (2), 7.1 (3), 7.4 (4), and 7.8 (5). Phantoms in images A and B have the same concentration (0.45 mM); phantoms in images C and D have the following concentrations: 0.31 mM (1), 0.33 mM (2), 0.38 mM), 0.42 mM (4), 0.45 mM (5).

