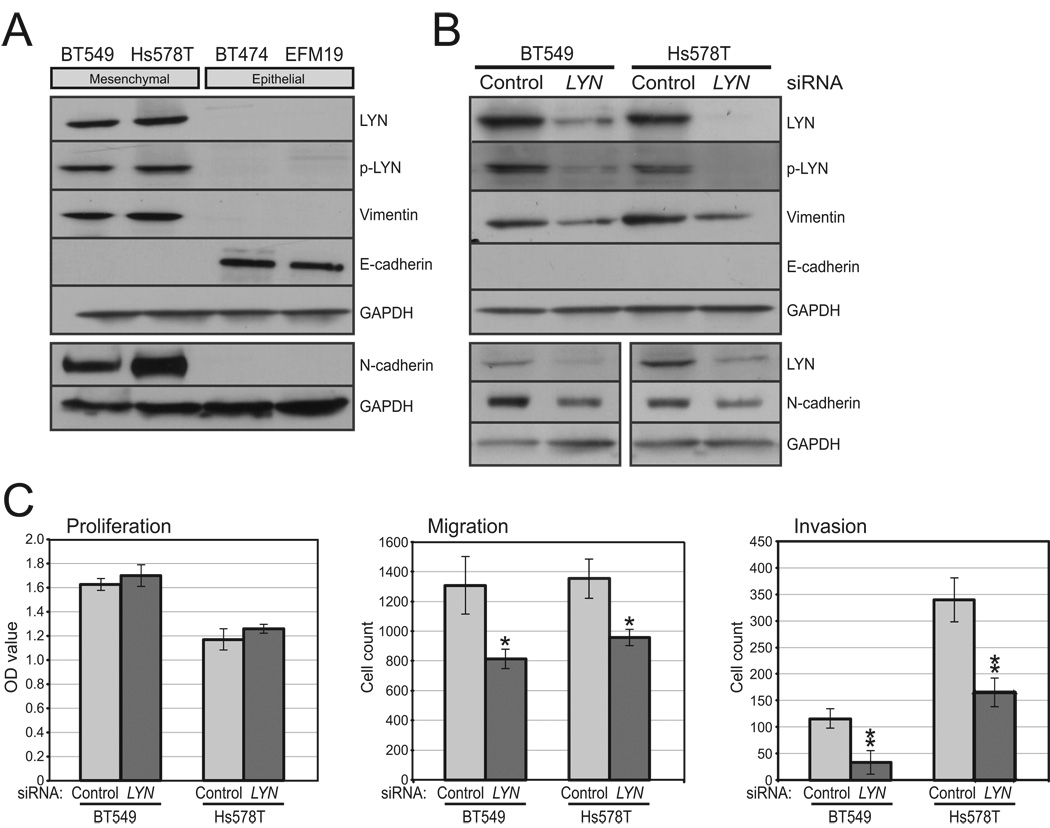
Figure 3. LYN overexpression contributes to invasiveness.
(A) LYN exhibits relative overexpression and activation in mesenchymal breast cancer lines. Shown is a Western blot probed with anti-LYN, phospho (activated)-LYN (Tyr507), vimentin and N-cadherin (markers of EMT), E-cadherin (a marker of epithelial morphology) (overnight exposure, positive control not shown), and GAPDH (loading control). (B) Validation of LYN knockdown by siRNA, and effect on vimentin, N-cadherin and E-cadherin levels. Transfected siRNA pools (LYN or control non-targeting siRNA) are indicated. (C) LYN knockdown (compared to non-targeting control) does not alter cell proliferation (left) (measured by WST-1 assay), but leads to significantly decreased cell migration (center) and invasion (right) (measured by Boyden chamber assay). Means and standard deviations shown. *, P<0.05, **, P<0.01; Student’s t-test.

