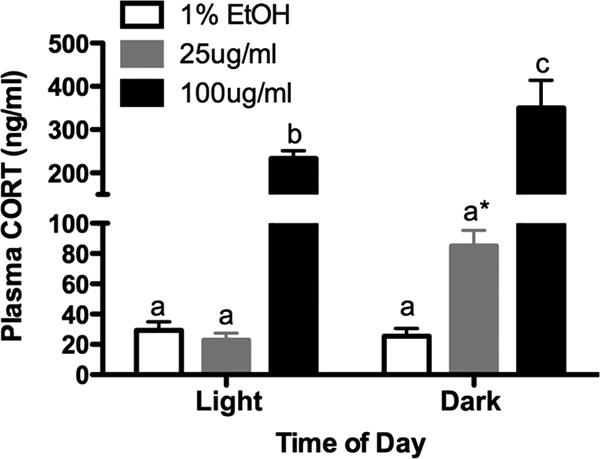
Figure 4.

CORT treatment results in changes in the diurnal pattern of plasma CORT levels. Graph depicts plasma CORT levels taken at the end of the 4-wk treatment, during the light (inactive) or dark (active) phases. Although low-CORT animals had slightly elevated plasma CORT during the dark period (although not statistically significant), high-CORT animals had elevated plasma CORT at both time points, in addition to the light-dark difference. Bars sharing the same letter are not statistically different from each other. Asterisk indicates P = 0.14.
