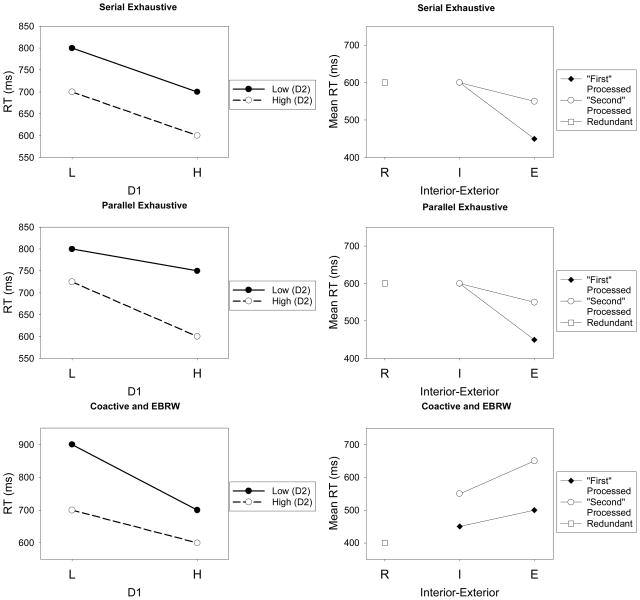
Figure 5.
Summary predictions of mean RTs from the alternative logical-rule models of classification. The left panels show the pattern of predictions for the target-category members, and the right panels show the pattern of predictions for the contrast-category members. Left panels: L = low-salience dimension value, H = high-salience dimension value, D1 = Dimension 1, D2 = Dimension 2. Right panels: R = redundant stimulus, I = interior-stimulus, E = exterior stimulus.


