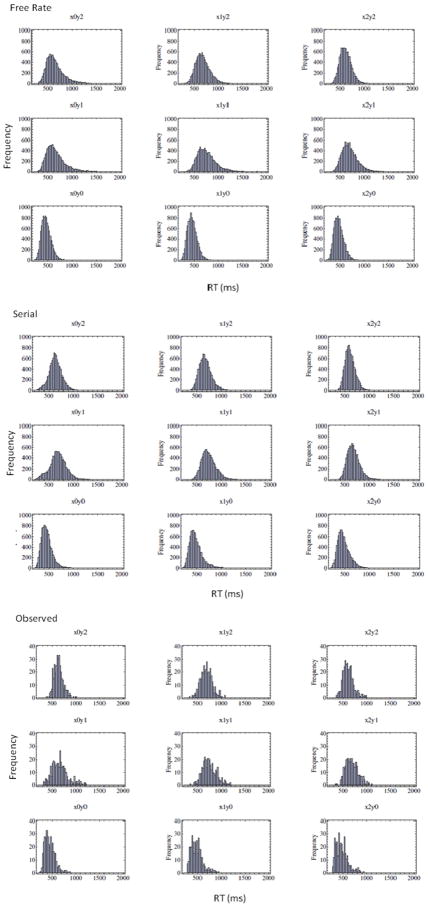
Figure 8.
Detailed depiction of the predicted and observed individual-stimulus RT distributions for Subject 2 of Experiment 1. Each bar of each histogram represents the predicted or observed number of entries in a 100-msec interval. Top panel: predictions from free stimulus-drift-rate model, Middle panel: predictions from serial self-terminating model with attention-switching, Bottom panel: observed data. Within each panel, the spatial layout of the stimuli is the same as in Figure 1.

