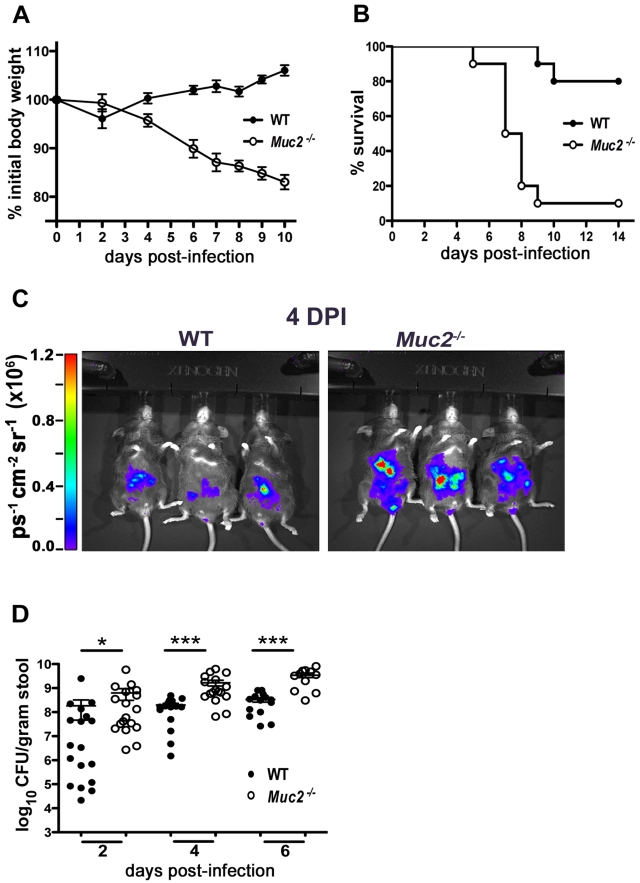
Figure 2. Muc2−/− mice exhibit dramatic susceptibility to C. rodentium-induced morbidity and mortality.
A. Body weights following C. rodentium infection of WT (n = 10) and Muc2−/− (n = 10) mice. Muc2−/− mice rapidly lose weight following C. rodentium infection. Results are representative of 2 independent experiments. B. Survival curve of WT mice (n = 10) and Muc2−/− mice (n = 10) following C. rodentium infection. Results are representative of 3 independent infections, each with 5–10 mice per group. C. Bioluminescent imaging showing WT and Muc2−/− mice at 4 DPI with a luciferase-expressing C. rodentium. The color bar is displayed on the left where red corresponds to the highest signal intensity and blue corresponds to the lowest signal intensity, with corresponding logarithmic units of light measurement (photons s−1 cm−2 seradian−1). Overall signal was significantly greater by 3–10 fold in the Muc2−/− mice vs. WT mice (*P = 0.039, students t-test, 3 mice per group). D. Enumeration of C. rodentium in stool at various times post-infection. Each data point represents one animal. Results are pooled from two separate infections. (2 DPI, *P = 0.013; 4 DPI, ***P<0.0001; 6 DPI, ***P = 0.0004, Mann-Whitney test).

