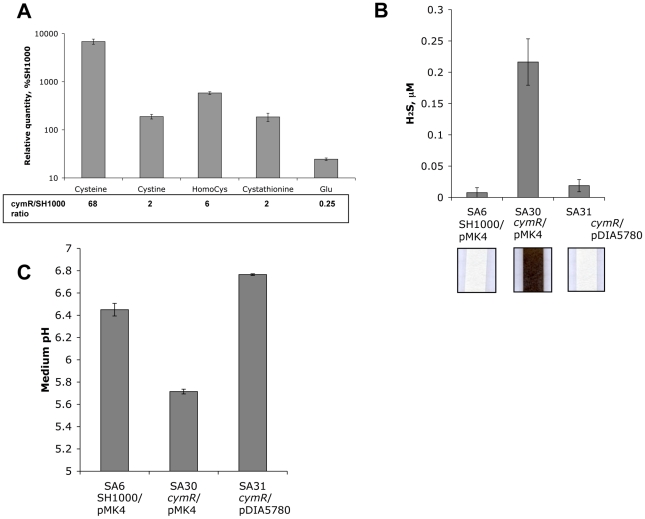
Figure 3. Metabolic changes in the ΔcymR mutant after growth in the presence of cystine.
The strains were grown in TSB medium with 2 mM cystine. A. Intracellular metabolite concentrations were estimated by HPLC for the ΔcymR mutant (SA17) and the parental SH1000 strain. The ΔcymR/SH1000 ratio is indicated. The complete data on metabolite concentrations are given in Table S3. B. H2S production measurement was performed using the quantitative methylene blue method and a Na2S standard curve. Representative results of lead-acetate paper assays are shown in the lower section. Strains SA6 (SH1000/pMK4), SA30 (ΔcymR/pMK4) and SA31 (ΔcymR/pDIA5780) were used. C. The pH of the medium was measured after an overnight culture (16 h) at 37°C. Strains SA6 (SH1000/pMK4), SA30 (ΔcymR/pMK4) and SA31 (ΔcymR/pDIA5780) were used. Results correspond to the mean values with standard deviations and are representative of at least two independent experiments.

