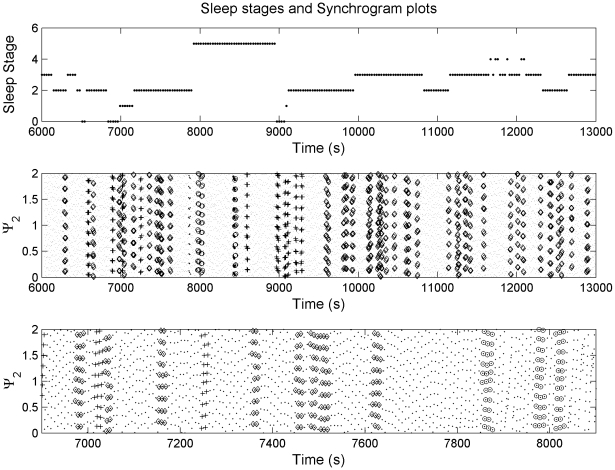
Figure 1. Synchrogram plot (second panel) revealing cardiorespiratory locking at different frequency ratios and sleep stages (rated at the top panel).
Small dots indicate the normalised phases. Diamond, plus and circle indicates 9∶2, 10∶2 and 11∶2 coordination respectively. The numbers 0–5 for sleep stage represents awake, stage 1, stage 2, stage 3, stage 4 and REM sleep respectively. The recorded data segment for this figure was selected such that all the sleep stages are available in order to compare the differences. For better visualisation, an expanded time scale version of the synchrogram plot (second panel) has been shown in the third panel.

