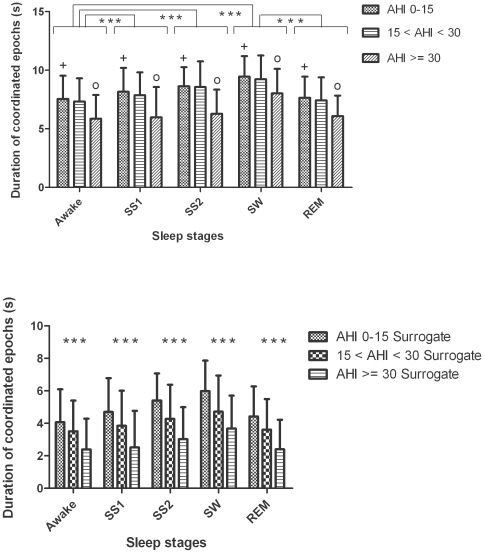
Figure 4. Group and sleep related comparison of average duration of coordinated epochs in seconds (AvDurCordn, mean ± SD) using original (upper panel) and surrogate data (lower panel) from abdominal signal.
The circle indicates that the differences in AvDurCordn between the moderate and severe OSA groups are significant (p<0.01) for all the sleep stages. Similarly, the plus indicates the significant differences (p<0.001) in AvDurCordn between no/mild and severe OSA groups for all the sleep stages. *** (p<0.0001) indicates the significant differences in AvDurCordn between different sleep stages as well as the original and surrogate data.

