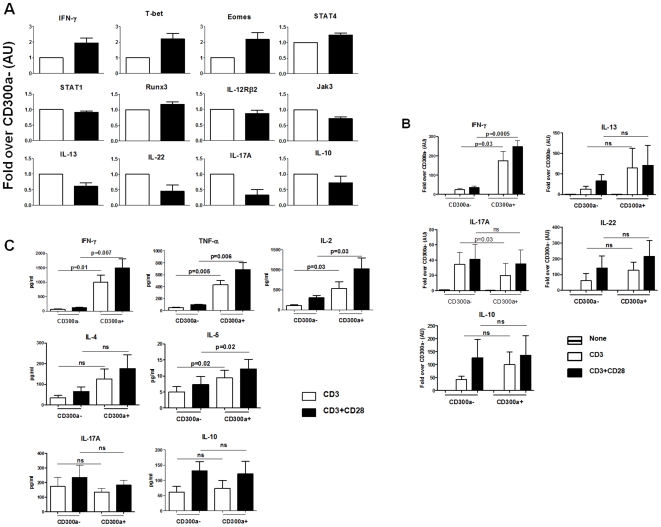
Figure 5. The cytokine and transcription factor signature of CD300a+ and CD300a− human memory CD4 T cells.
(A) Purified CD4 T cells were sorted into CD45RO+CD300a+ (black bars) and CD45RO+CD300a− (white bars). RNA was extracted and the levels of mRNAs were determined by real-time PCR. Graphs represent the average ± SEM. AU: arbitrary units. Data are from 5–6 donors. These data correspond to the untreated (none) samples in Figures 5B and 6A. (B) Purified CD4 T cells were sorted into CD45RO+CD300a+ and CD45RO+CD300a− and then stimulated overnight with plate bound anti-CD3 or anti-CD3 plus anti-CD28 mAb. RNA was extracted from cells and specific cytokine mRNAs were quantified by real-time PCR. (C) Supernatants from the cultures were harvested and the levels of cytokines were measured.

