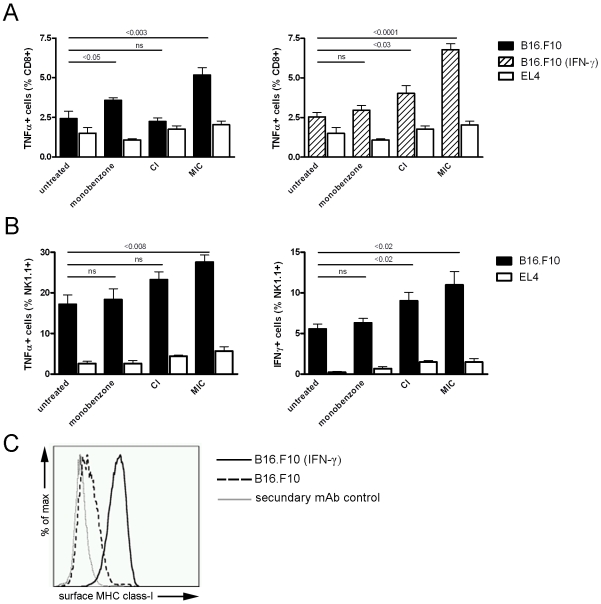
Figure 1. MIC treatment of subcutaneous B16.F10 melanoma induced melanoma-reactive CD8+ T cells and -NK cells in vivo.
Splenocytes were tested for their ex vivo activation upon co-culture with B16.F10 melanoma or EL4 thymoma control cells (n = 5 mice per group). A, Left panel: CD8+ T cells from monobenzone- and MIC-treated mice showed significant TNF-α production upon co-culture with melanoma cells (black bars; p<0.05 and p<0.003 respectively). In contrast, CD8+ T cells from CI-treated mice did not display significant TNF-α production upon melanoma cell co-culture (non significant difference: ns). Right panel: To identify CD8+ T cell activation upon co-culture with immunogenic melanoma cells with high MHC class-I expression, co-cultures with IFN-γ primed B16.F10 cells were included (dashed bars). Under these conditions, CI-treated mice showed significant TNF-α production as compared to untreated mice (p<0.03). The MIC-treated mice showed even more TNF-α production as in the non-IFN-γ-primed stimulation shown in the left panel. Monobenzone-treated and untreated mice did not display this increased T cell activation upon splenocyte co-culture with IFN-γ primed melanoma cells. T cell activation upon splenocyte co-culture with syngeneic EL4 thymoma control cells showed comparable background levels in all groups (white bars). B, Left panel: Only NK cells from MIC-treated mice showed significantly increased TNF-α production upon co-culture with melanoma cells (p<0.008). Right panel: Elevated production of IFN-γ was found in NK cells from CI- and MIC-treated mice in response to co-culture with melanoma cells (p<0.02 and p<0.02 respectively). TNF-α and IFN-γ production by NK cells was comparable in all groups upon co-culture with EL4 control cells. For the statistical analysis of the in vivo tumor growth kinetics of the treatments depicted in this figure, see table 1 (“Exp. 2”). C, B16.F10 melanoma cells upregulate their surface MHC class-I expression upon IFN-γ exposure. While IFN-γ-unexposed melanoma cells express very low levels of surface MHC class-I (dashed line), priming of these cells with 1000 U/ml IFN-γ restores their surface expression of MHC class-I (black line). Control incubations of IFN-γ-primed melanoma cells with only the IgG2a-detecting secondary antibody were negative (grey line).

