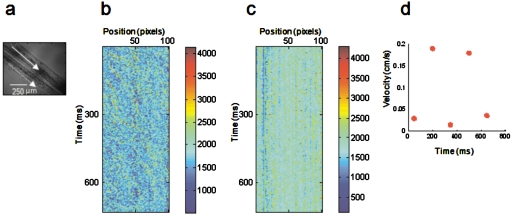
Figure 10.
(a) Tail of a zebra fish larvae. The solid white arrow indicates the location and direction of the first scan, along a blood vessel. The scan was performed to measure flow through a blood vessel running along the tail of the fish. (b) The carpet plot for a series of scans—a series of curving, approximately diagonal lines can be seen in the carpet. The slope of the line changes with the heart rate of the fish. (c) The SLIC carpet from a scan along the dashed line in (a). There is no blood vessel here, and no flow can be seen in the carpet. (d) shows the blood velocities extrapolated from the slope of lines in the SLIC carpet (b).

