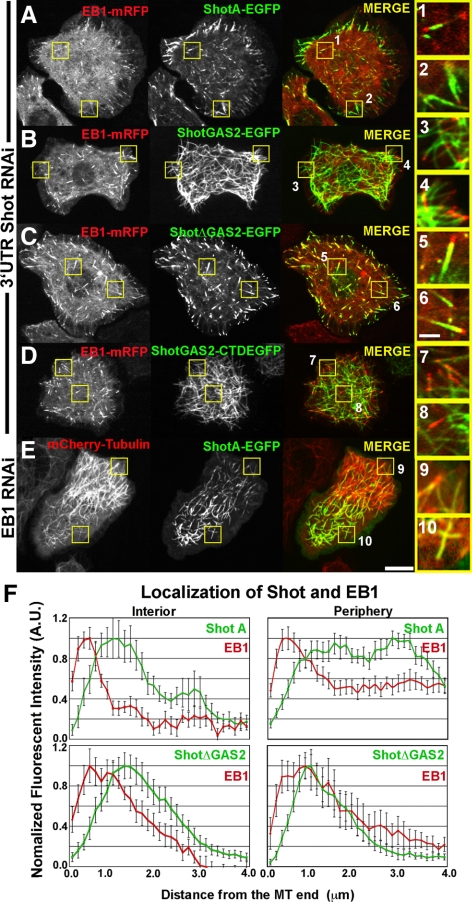
Figure 3.
Shot has two distinct modes of interacting with microtubules. (A) An S2 cell cotransfected with EB1-mRFP (left, red in merged image) and full-length Shot A (middle, green in merged image) after depletion of endogenous Shot using RNAi designed against the 3′-UTR of Shot. High-magnification images to the far right highlight Shot A and EB1 in the interior (1) and perimeter (2). (B) An S2 cell expressing EB1-mRFP (left, red in merged image) and the GAS2 domain of Shot (middle, green in merged image) after RNAi depletion of endogenous Shot. High-magnification images (3 and 4, far right) demonstrate that the GAS2 binds along the lattice of microtubules and does not plus end track. (C) EB1-mRFP (left, red in merged image) and ShotAΔGAS2 (middle, green in merged image) coexpressed in an S2 cell after depletion of endogenous Shot by RNAi against 3′-UTR of Shot. Higher magnification images (5 and 6, far right) demonstrate that ShotAΔGAS2 plus end tracks and does not bind to the lattice. (D) An S2 cell coexpressing EB1-mRFP (left, red in merged image) and ShotGAS2-CTD (middle, green in merged image) after depletion of endogenous Shot. Higher magnification images (7 and 8 far right) indicate that despite having the EB1 binding CTD, the GAS2 domain targets this fusion to the microtubule lattice. (E) An S2 cells expressing mCherry-Tubulin (left, red in merged image) and Shot A after RNAi depletion of EB1. High-magnification images (9 and 10, far right) indicate that ShotA maintains lattice association despite loss of +TIP association. (F) Graphical representations of line scans plotting the distribution of Shot (green) and EB1 (red) at the cell interior (top left), Shot A and EB1 at the cell periphery (top right), and ShotΔGAS2 and EB1 in the cell interior (bottom left) and at the cell periphery (bottom right), with their distributions being very similar at the two locations. For each graph, the average fluorescence intensity of 10–15 individual microtubules was plotted against the distance from the microtubule end. Two populations where measured, in the cell interior and at the cell periphery (1–5 μm in from the cell margin). Bar 10 μm (low-magnification images) and 2 μm (high-magnification images) (far right).

